FAQ
Problems and resolutions
NAbox unreachable
If NAbox is not reachable after initial deployment, the first thing to check is the network configuration in the vApp (Configure > vApp Options > Properties)
A common mistake is to omit the netmask bit after the IP address, like
a.b.c.d/m, this is the mandatory IP address format during configuration.
Adding 7-mode systems
Check that you enabled TLS with options tls.enable on.
Also check the following options : httpd.admin.access, httpd.admin.hostsequiv.enable
General questions
Root access
At your own risk, for troubleshooting or customizing purpose, you can access the
virtual appliance root shell using sudo bash after logging in as admin through
ssh
Reset password
To reset admin password, you need to use vSphere console to the VM and
interrupt normal boot.
-
When the following boot loader appears, type
ekey to edit Flatcar default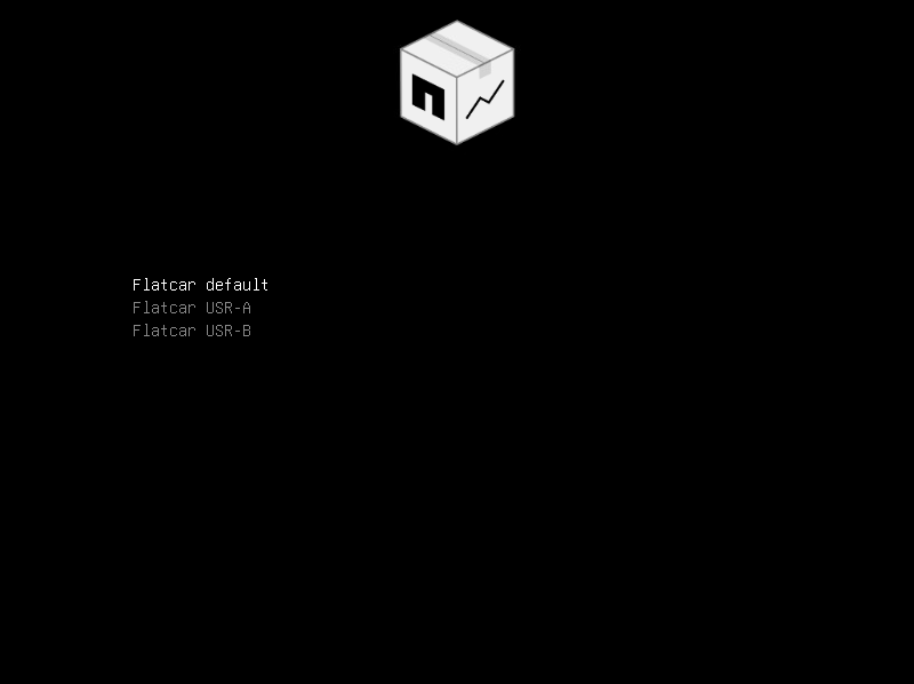
-
Add
init=/bin/shat the end of the line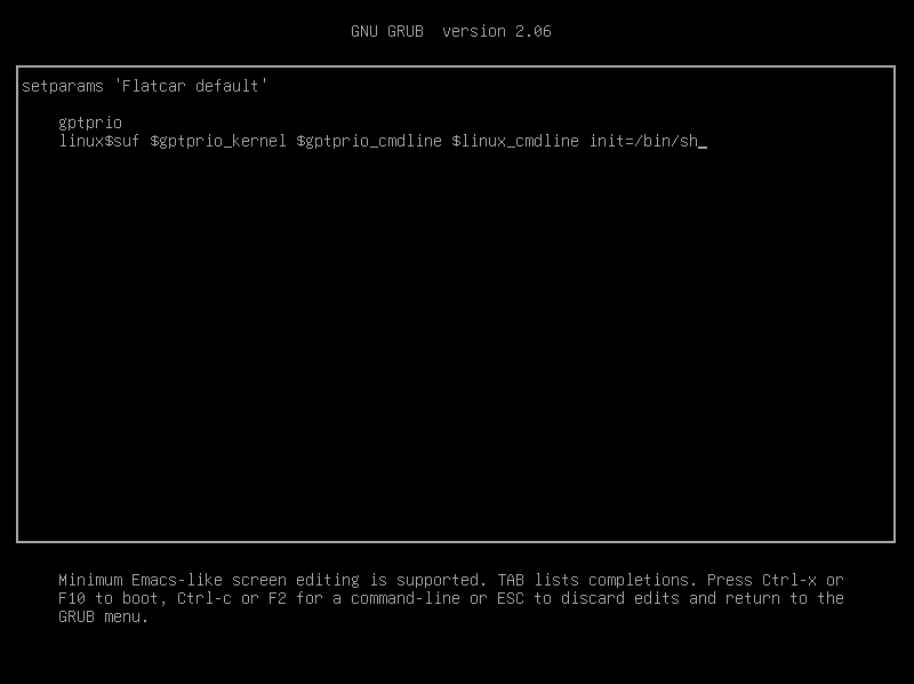
-
Type
F10to boot -
Once the prompt is available, change
adminpassword
sh-5.2# passwd admin
New password:
Retype new password:
passwd: password updated successfully
- Commit changes to disk
# sync
- Reboot the VM
Increase data disk
To increase the /data partition that stores historical data and is 200GB by default, simply increase the underlying disk (VMDK in vCenter) and reboot NAbox.
Managing metrics
Delete data
Metrics can be deleted using API calls to Victoria Metrics. Note that un-authenticated access to Victoria Metrics is disabled by default and can be enabled in NAbox preferences.
-
Delete metrics for a given cluster
# Delete metrics for cluster2 curl -k -s \ 'https://nabox_ip/vm/api/v1/admin/tsdb/delete_series?match[]=\{cluster="cluster2"\}' # Purge data from disk curl -k -s 'https://nabox_ip/vm/internal/force_merge' -
Delete metrics for a given volume
# Delete metrics for volume `myvolume`
curl -k -s \
  'https://nabox_ip/vm/api/v1/admin/tsdb/delete_series?match[]=\{volume="myvolume"\}'
# Purge data from disk
curl -k -s 'https://nabox_ip/vm/internal/force_merge'
Don't forget to turn back off guest access to metrics if you had to turn it on.
Delete old data
Removing older data from NAbox 4 is done by deleting directories in /data/victoria-metrics-data/data/big and /data/victoria-metrics-data/data/small
after a graceful shutdown of Victoria Metrics.
-
Stop Victoria Metrics service
dc stop victoria-metrics -
Remove folders from data directories
$ sudo bash # cd /data/victoria-metrics-data/data/small # ls -al total 28 drwxr-xr-x. 7 root root 4096 Jul 1 00:00 . drwxr-xr-x. 4 root root 4096 Apr 28 20:38 .. drwxr-xr-x. 30 root root 4096 May 1 00:00 2024_04 drwxr-xr-x. 52 root root 4096 Jun 1 00:00 2024_05 drwxr-xr-x. 36 root root 4096 Jul 1 00:00 2024_06 drwxr-xr-x. 39 root root 4096 Jul 9 10:41 2024_07 drwxr-xr-x. 2 root root 4096 Apr 28 20:38 snapshots # rm -rf 2024_04 # cd ../big/ # ls -al total 28 drwxr-xr-x. 7 root root 4096 Jul 1 00:00 . drwxr-xr-x. 4 root root 4096 Apr 28 20:38 .. drwxr-xr-x. 5 root root 4096 Apr 30 20:47 2024_04 drwxr-xr-x. 5 root root 4096 May 28 03:31 2024_05 drwxr-xr-x. 4 root root 4096 Jun 23 22:30 2024_06 drwxr-xr-x. 2 root root 4096 Jul 1 00:00 2024_07 drwxr-xr-x. 2 root root 4096 Apr 28 20:38 snapshots # rm -rf 2024_04 -
Start Victoria Metrics service
dc start victoria-metrics
Change default retention
If you find that 2 years of data retention is not appropriate in your environment, you can override the default
by editing /etc/nabox/.env.custom and add/change the following line.
The exact content of this file may vary, if the line retentionPeriod is not
present, you have to add it.
DOCKER_SUBNET=192.0.0.0/24
GF_AUTH_LDAP_ENABLED=true
GF_AUTH_LDAP_CONFIG_FILE=
GF_AUTH_ANONYMOUS_ENABLED=true
GF_SERVER_DOMAIN=10.1.0.133
GF_SMTP_ENABLED=true
GF_SMTP_HOST=smtp.mail.me.com:587
GF_SMTP_USER=ybizeul@me.com
GF_SMTP_PASSWORD=cxiu-oefj-aapz-ssjd
GF_SMTP_FROM_ADDRESS=yann@tynsoe.org
PROMETHEUS_NABOX_AUTH=
retentionPeriod=2y
After the change, you have to restart services :
# dc up -d
Customize Harvest
NAbox lets you customize harvest templates as described in Harvest docs.
Customization must be done in CLI in the /etc/nabox/harvest/user folder.
/etc/nabox/harvest/user                       # User customization directory
├─ /zapi                                      # Collector specific customization directory
│  ├─ /cdot/9.8/                              # Version aware template directory
│  │  └─ custom_my_ignore_list_template.yaml  # Template file
│  └─ custom.yaml                             # Customization file
└─ /zapiperf
   ├─ /cdot/9.8/
   │  └─custom_my_ignore_list_template.yaml
   └─ custom.yaml
Extending templates is only supported by the Zapi / ZapiPerf collectors
The Harvest REST collector only supports replacing one of the builtin templates with one of your own.
The REST collector does not support template extending, so if you choose to
prefer Rest over Zapi in Preferences
make sure that you do your customization based on the templates in
/data/packages/harvest/conf/rest/9.x.0/ (most
template files reside in the 9.12.0 directory).
Common practice is to copy the needed file(s) and do the necessary modifications, it will override the default Harvest file for the object definition.
Note about built-in customizations
NAbox defines its own customizations in /etc/nabox/harvest/nabox.
Symbolic links are created pointing to /etc/nabox/harvest/nabox.available/
directories.
/etc/nabox/harvest
├─ /nabox
│  ├─ /collect-workloads -> ../nabox.available/collect-workloads
│  └─ /exclude-transient-volumes -> ../nabox.available/exclude-transient-volumes
└─ /nabox.available/
   ├─ /collect-workloads
   └─ /exclude-transient-volumes
exclude-transient-volumes is always enabled, while collect-workloads is
only enabled according to user preferences in NAbox web ui.
During start up, NAbox merges all customizations into /etc/nabox/harvest/active
/etc/nabox/harvest/active
├─ /zapiperf
│  ├─ /custom.yaml
│  └─ /cdot/9.8.0
│     ├─/custom_my_ignore_list_template.yaml
│     ├─/exclude_transient_volumes.yaml
└─ /zapi
   ├─ /custom.yaml
   └─ /cdot/9.8.0
      ├─/custom_my_ignore_list_template.yaml
      ├─/exclude_transient_volumes.yaml
zapiperf/custom.yaml content :
objects:
    Volume: exclude_transient_volumes.yaml,custom_my_ignore_list_template.yaml
    Workload: workload.yaml,exclude_transient_volumes.yaml,custom_my_ignore_list_template.yaml
    WorkloadDetail: workload_detail.yaml,exclude_transient_volumes.yaml,custom_my_ignore_list_template.yaml
    WorkloadDetailVolume: workload_detail_volume.yaml,exclude_transient_volumes.yaml,custom_my_ignore_list_template.yaml
    WorkloadVolume: workload_volume.yaml,exclude_transient_volumes.yaml,custom_my_ignore_list_template.yaml
zapi/custom.yaml content :
objects:
    Volume: exclude_transient_volumes.yaml,custom_my_ignore_list_template.yaml
Example : exclude collection based on volume name
To ignore volumes that you don't want to be collected by Harvest performance and/or capacity pollers, you can follow these steps.
-
Create
/etc/nabox/harvest/user/zapiperf/custom.yamlobjects: Volume: custom_my_ignore_list_template.yaml Workload: custom_my_ignore_list_template.yaml WorkloadDetail: custom_my_ignore_list_template.yaml WorkloadDetailVolume: custom_my_ignore_list_template.yaml WorkloadVolume: custom_my_ignore_list_template.yaml -
Create
/etc/nabox/harvest/user/zapiperf/cdot/9.8.0/custom_my_ignore_list_template.yamlplugins: LabelAgent: exclude_regex: - volume `Test_volume.*` - volume `Temp_volume.*` -
We need to do the same for Zapi poller. Create
/etc/nabox/harvest/user/zapi/custom.yamlobjects: Volume: custom_my_ignore_list_template.yaml -
Create
/etc/nabox/harvest/user/zapi/cdot/9.8.0/custom_my_ignore_list_template.yamlplugins: LabelAgent: exclude_regex: - volume `Test_volume.*` - volume `Temp_volume.*` -
Restart Harvest
dc restart havrest